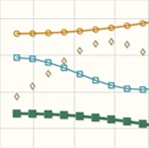
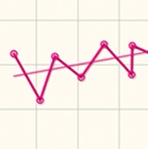
Numerous line style options with 6 built in marker styles!
<div id="chart"></div>
<script>
$(function(){
  $.jqplot("chart", [[1, 2, 3]]);
});
</script>
<div id="chart"></div>
<script>
$(function(){
  $.jqplot("chart", [[1, 2, 3]], {
    title: 'Chart title'
  });
});
</script>
<div id="chart"></div>
<script>
$(function(){
  var s1 = [['/home',46], ['/var',14], ['/tmp',5], ['/',35]];

  var plot1 = $.jqplot('chart', [s1], {
    title: 'Disc usage',
    seriesDefaults: {
      renderer: $.jqplot.PieRenderer,
      rendererOptions: {
        showDataLabels: true,
        labelColor: "red",
        showDataCategoryOnHover : true,
        sliceMargin: 1,
        ringMargin: 8,
      }
    },
    legend: { show:true, location: 'e'}
  });
});
</script>
Use hooks to create plugins see plugin creation tutorial here.
Browse our plugins directory to find the your needed tools for your needs.
jQPlot has an extensive utility belt for plugin developers. Learn how to build your plugins & share.
jQPlot is hosted on GitHub. Have a suggestion or found a bug? Fork this project to help make jQPlot even better.